Bankruptcy Statistics for 2015: The Face of Insolvency is Changing in Canada
Statistics Canada keeps close tabs on the economic status of Canadian consumers, and publishes its findings yearly. Similarly, the Office of the Superintendent of Bankruptcy Canada (OSB) records statistics specifically on insolvency. Drilling down into the data reveals both cautionary and inspiring trends.
Note that Statistics Canada defines a consumer as an individual with more than 50 percent of total liabilities related to consumer goods and services. This definition differentiates a consumer from a business organization.
Both Bankruptcy and Consumer Proposal are insolvency solutions regulated by the OSB, via Canada’s Bankruptcy and Insolvency Act. In both cases, a federally licensed Trustee must act on behalf of the consumer and the creditors, to formulate an acceptable solution. Note that as of April 2016, the title “Licensed Insolvency Trustee” (LIT) will replace the older “Bankruptcy Trustee”.
Most people are surprised when they learn how many Canadian consumers have filed for Bankruptcy or Consumer Proposal as an insolvency solution in the past ten years: over one million individuals.
The Trend Toward More Consumer Proposals
Although Consumer Proposal became possible in the mid-1990s, the solution was little used at the time. According to the OSB, in 2000, a scant 6.4% of Canadian consumer insolvencies were handled via Consumer Proposal. However, as shown in the graph below, by 2015 Consumer Proposal rivalled Bankruptcy, at 47.9% of insolvencies. The increase is attributable to better consumer education – if a consumer with regular income acts early enough, Consumer Proposal may be a preferable option. The solution has also gained ground with Trustees, attracted by the better workload/revenue profile of Consumer Proposals.
In Ontario, the rate of Consumer Proposal now exceeds that of Bankruptcy, at 55% of insolvencies addressed in 2015.

Insolvency Rate Steadily Decreasing
The news on Canadian consumer insolvency is good: rates have been decreasing. The insolvency rate as a percentage of the Canadian adult population has steadily gone down since 2009’s peak of 5.8 insolvencies per 1,000 consumers, levelling off in recent years near 4 per 1,000.
It’s an improvement – but does it represent a true recovery and a more robust consumer economy? Things are less certain when one takes into account the consumer insolvency rate in 1990 of only 2.1 per 1,000 consumers.
Consumers Are Not Out of the Woods
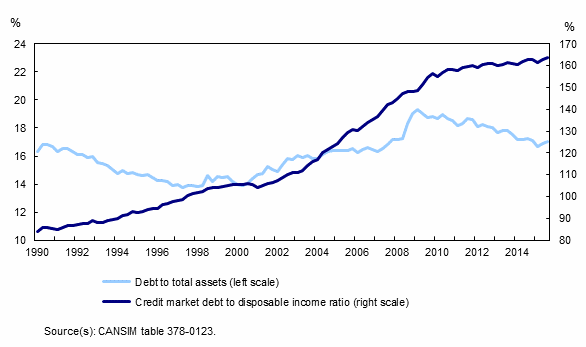
Statistics Canada has published this graph of Household Sector Leverage Indicators, 1990 to Q3 2015. During this time, the ratio of consumer debt to total household assets (light blue line) has fluctuated and risen slightly. Truly alarming, though, is the rise of the dark blue line of credit market debt (which includes mortgage and non-mortgage loans) to disposable income.
By the third quarter of 2015, Canadians collectively had $1.64 of debt for every $1.00 of yearly income.
Household Sector Leverage Indicators, 1990 to Q3 2015 (by Statistics Canada)

This statistic would not be so alarming if it were isolated. However, it is part of a longstanding trend that began 25 years ago. We observe that the curve begins flattening in 2010 – a good sign! – but consumers aren’t out of the woods. The rise in this ratio – the very ratio that produces consumer insolvencies – is stubborn. In 2016, Bankruptcy and Consumer Proposal are likely to be the recourse of another 100,000 Canadians, give or take a few.
